
The Project Timeline
Use a project's Gantt chart to see when work is scheduled, drag tasks to new dates, and keep notes on delays and changes
On this page
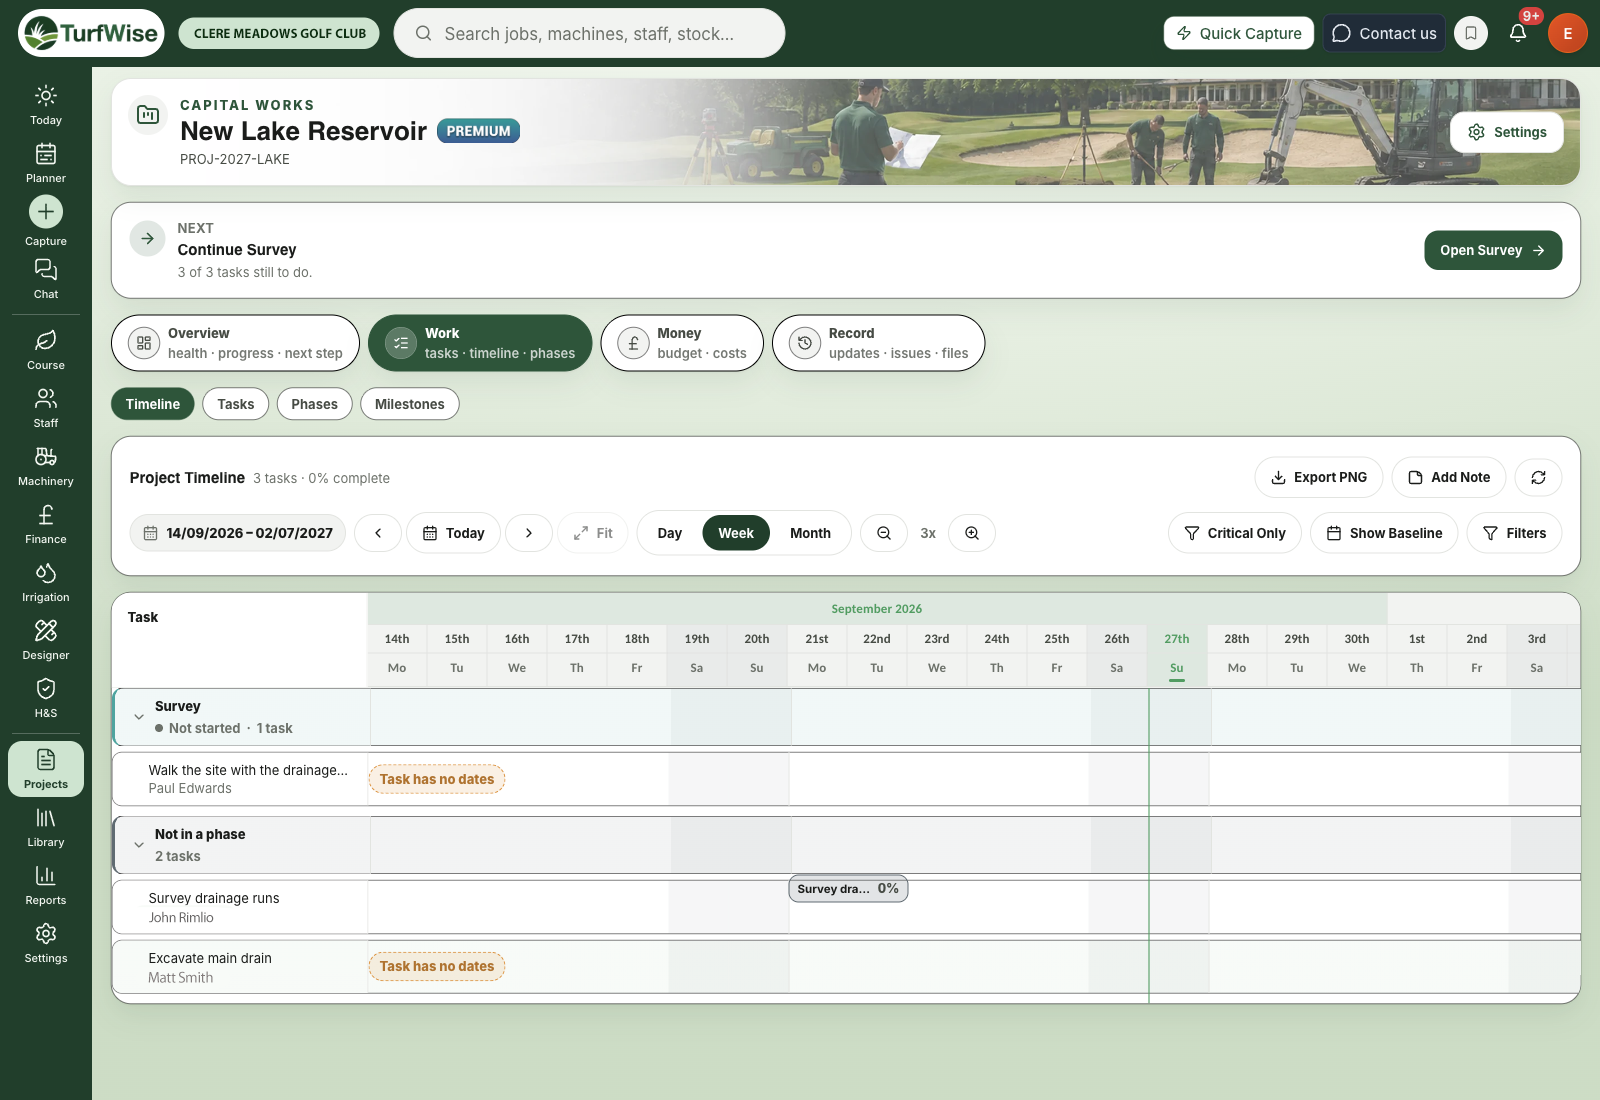
The project timeline is a Gantt chart that draws every dated task and phase as a bar, so you can see what happens when — and move things when plans change.
Premium
Projects, including the timeline, are part of the Premium plan.
Where is the timeline?
Open a project, click the Work chip and choose Timeline. Once the project or any of its tasks has dates, the Work chip opens here by default.
 Open full-size image ↗
Why is my timeline empty?
The timeline only draws work that has dates. If nothing is dated, you'll see Nothing has dates yet, with a message telling you what's missing:
- Phases with no dates — click Add dates to phases.
- Tasks with no scheduled days — click Schedule the tasks.
- No work at all — click Add a task.
A deadline isn't a schedule
A task's Deadline says when it must be finished by — it doesn't draw a bar. Open the task and set the days it's Scheduled for.
How do I read the chart?
- Work is grouped under its phases, with each task as a bar across the days it's scheduled for. Weekends are shaded.
- Bar colours show the task status — Not started, In progress, Complete, On hold and so on. Critical-path tasks are marked.
- Turn on Show Baseline to compare the originally planned dates with what actually happened, for tasks that have actual dates recorded.
- Milestones appear as diamonds, with their name alongside.
- Arrows between bars show dependencies — which tasks have to wait for others.
- Timeline notes appear as markers on their date.
How do I move around the chart?
The toolbar has everything you need:
-
Day, Week and Month — change the scale.
-
Zoom in and Zoom out — make the columns wider or narrower.
-
Earlier and Later — scroll back and forward.
-
Today — centre the chart on today's date.
-
Fit — fit the view back around the work.
-
Refresh — reload the latest data.
-
Critical Only — show just the critical-path tasks (click Show All to go back).
-
Show Baseline — overlay the originally planned dates on each bar.
Click Filters to open Advanced Filters and show only certain sections, statuses or assignees, or a date range. Clear All removes the filters.
How do I reschedule a task?
Drag the bar
Drag a task's bar to its new position on the chart.
Check the new dates
The Reschedule Task box shows the current start and end beside the new ones.
Decide about the tasks that follow
If later tasks depend on this one, you'll see a Dependency Warning. Tick Also shift all following tasks to move them along by the same amount.
Confirm
Click Confirm Reschedule (or Reschedule … Tasks if you're moving the following tasks too). The chart redraws with the new dates.
Keep delays on the record
When a task slips because of weather or a supplier, add a timeline note at the same time. It saves a lot of explaining at the next committee meeting.
Editing a task from the chart
Click a task to open its details — its Planned dates, Actual dates, hours, who it's Assigned to and any Dependencies. Click Edit to change the title, status, priority, progress, planned start and end, estimated and actual hours, description and tags, or to mark it as Critical path. Click Save changes when you're done.
To change who a task is assigned to, open it from Tasks instead.
How do I add a note to the timeline?
Click Add Note. Pick a date and a Note Type:
- General — a general note or observation
- Milestone — a key achievement or checkpoint
- Delay — weather, resource or scheduling delays
- Risk — a risk identified or dealt with
- Change — a change of scope or requirements
Give it a title and any detail, and it appears as a marker on the chart. You can delete a note from its marker.
Can I share the timeline?
Yes — click Export PNG to download the chart as an image you can drop into a report or email.