
Disease Prediction and Disease & Stress
How TurfWise estimates disease risk from your weather, where you see it, and how to log what you actually find on the course
On this page
TurfWise runs turf disease models against your course's weather to show you when conditions favour disease — and gives you one place to log what you actually see.
You'll meet disease risk in two places: the Course hub, which everyone gets, and the Disease & Stress page, which goes much deeper.
Where do I see today's disease risk?
Click Course in the top bar, then Turf & growth. On the Turf Intelligence dashboard you'll find:
- Disease risk card in the top summary — whichever disease is highest right now, with its percentage and trend
- Disease risk panel — a percentage, a trend arrow and a short note for Fusarium, Dollar Spot and Anthracnose
- 7-day disease forecast chart — how those three are expected to move over the coming week, with the area above 66% shaded as High risk
On the hub, bars are green for lower risk, amber for moderate and red for high.
A model, not a diagnosis
Risk scores come from weather data. They don't know what you saw on your morning walk, what you sprayed last week, or how sheltered the 14th green is. Use them alongside your own eyes, not instead of them.
Why is the Disease risk panel empty?
TurfWise only runs the models when it has a real humidity reading and the forecast averages it needs. If either is missing, it shows nothing rather than a made-up low score. Check your weather setup in Weather.
What's on the Disease & Stress page?
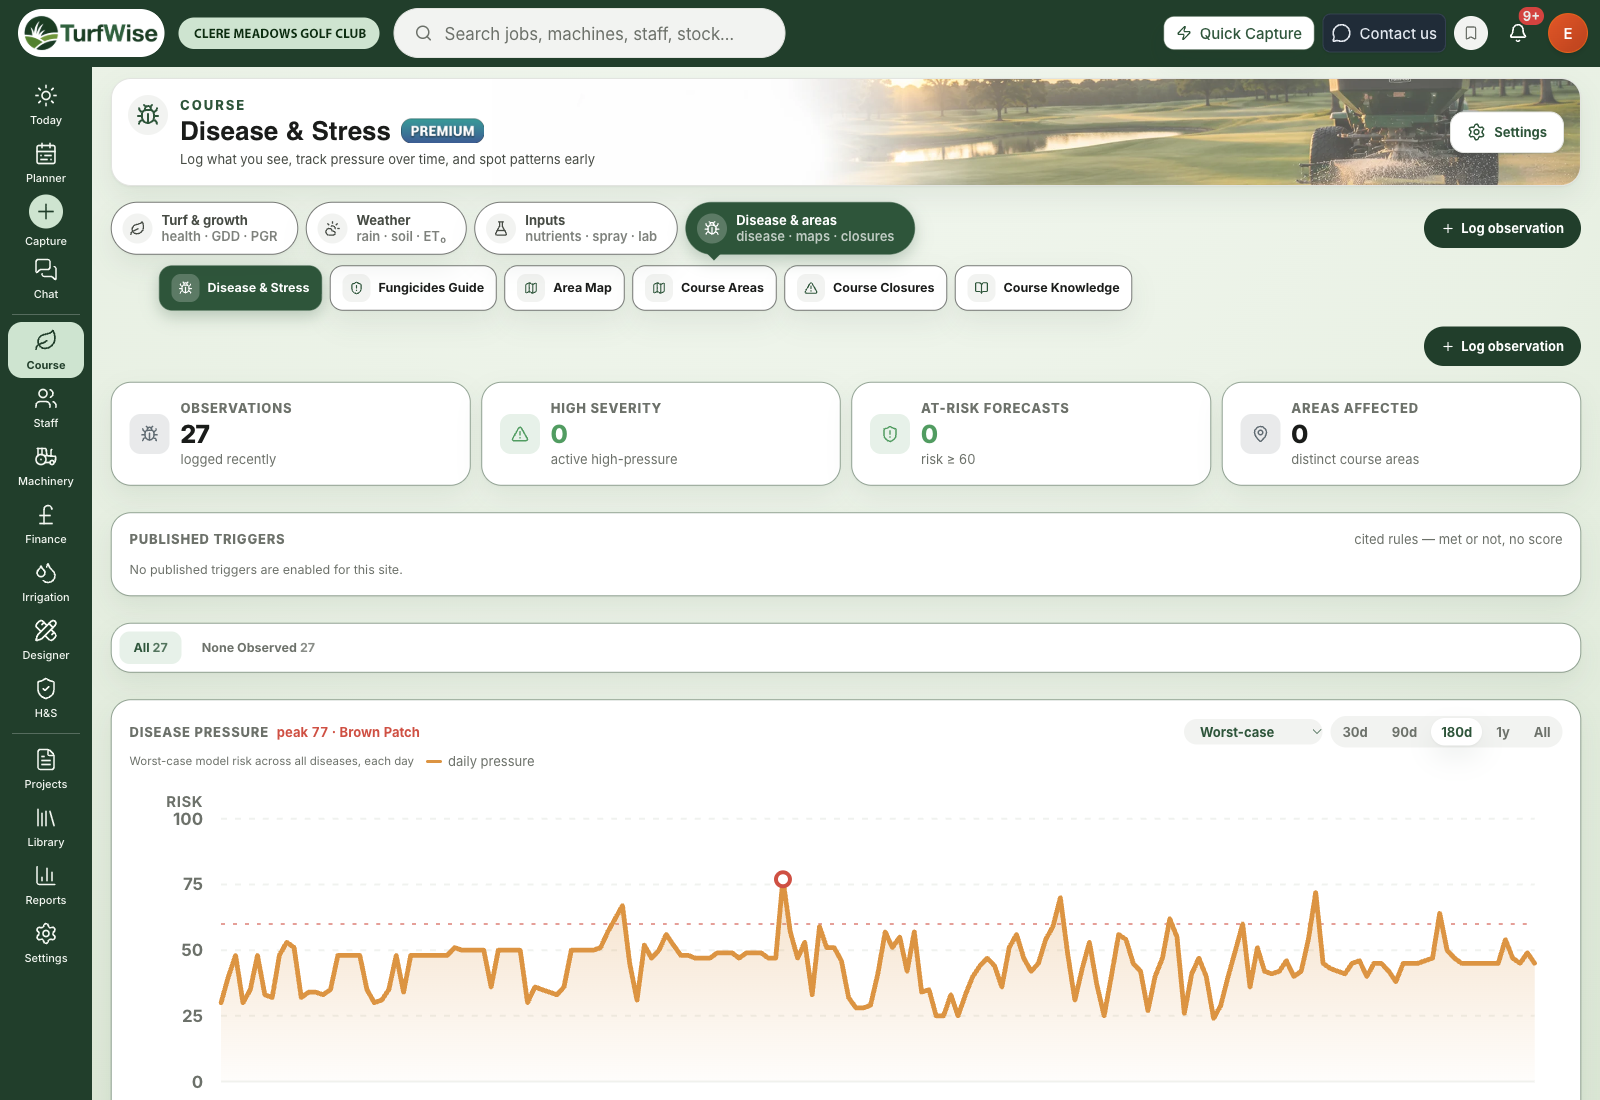
Click Course in the top bar, then Disease & areas › Disease & Stress — or use the Log observation button in the header of most Course pages to record a sighting without leaving the page.
Premium
Disease & Stress needs Premium. On Core you still get the three disease risks and the 7-day forecast on the Course hub.
 Open full-size image ↗
The top cards
- Observations — how many you've logged recently
- High severity — observations marked High
- At-risk forecasts — saved forecasts with a risk score of 60 or more
- Areas affected — how many different course areas have observations
Highest forecast pressure
The four highest saved risk scores, each with the disease, the area (or "Course-wide") and the date.
Published triggers
These are different from risk scores. Each one is a published research rule that's either met or not — so there's no percentage. The triggers are:
- Pythium Blight
- Fairy Ring (timing)
If none are switched on for your site, the panel says so.
Each card shows a verdict — Met, Not met, Act now or No verdict (not enough data) — with the reasoning, the research it comes from and a confidence figure. An estimated tag means part of the input had to be estimated.
Disease pressure chart
A day-by-day chart of disease pressure, rebuilt from your stored weather history. Use the drop-down to show:
- Worst-case — the highest risk of any disease each day
- All diseases — one line per modelled disease
- a single disease on its own
Pick 30d, 90d, 180d, 1y or All. Your own observations appear as rings on the Observed strip under the chart — red for High, amber for Medium and grey for Low severity — so you can see whether the model and reality lined up.
Pest pressure — Leatherjackets
This card shows expected leatherjacket activity as a stepped band, with the expected life stage underneath. It's based on the time of year and checks your soil temperature to see whether larvae are likely to be feeding.
Experimental
The leatherjacket card is marked Experimental. It shows seasonal expectation, not a count of how many are in your soil.
How do I log a disease observation?
Staff logins can see observations, but logging one needs a manager or admin login.
Click Log observation
On the Disease & Stress page, click Log observation at the top. (The button of the same name on other Course pages brings you to Disease & Stress first.)
Say where and what
Choose the Course Area and the Disease — Fusarium Patch, Red Thread, Take-All Patch, Anthracnose, Dollar Spot, Brown Patch or Pythium Blight.
Rate it and date it
Set the Severity (Low, Medium or High) and the Observed Date.
Add the detail
Optionally add a Specific Location (for example "near 5th tee, left side"), Observation Notes and any Treatment Applied.
Save
Click Log Observation. It appears in the table at the bottom of the page and as a marker on the pressure chart.
The table shows Date, Disease, Severity, Area, Logged by and Treatment. Use the chips above it to filter by disease.
Log the small stuff too
A single spot of red thread is worth logging. Over a season those entries show you which areas keep coming back, and how well the model matches your course.
Common problems
- "The pressure chart says it can't load" — read the message. The most common cause is that your club has no course location on record. Set it in Settings (under your avatar, top right) › Weather & integrations.
- "Published triggers says No verdict" — there wasn't enough weather data to decide either way.
- "The model says low but I can see disease" — trust your eyes and log it. Local shade, airflow and drainage aren't in the weather data.