
Rainfall
Track daily rainfall, add your own gauge readings, import and export CSV files, and compare this year with last
On this page
The Rainfall page keeps a day-by-day record of how much rain has fallen on your course, so you can plan drainage work, adjust irrigation and answer the committee's "how wet has it been?" with real numbers.
Where do I find it?
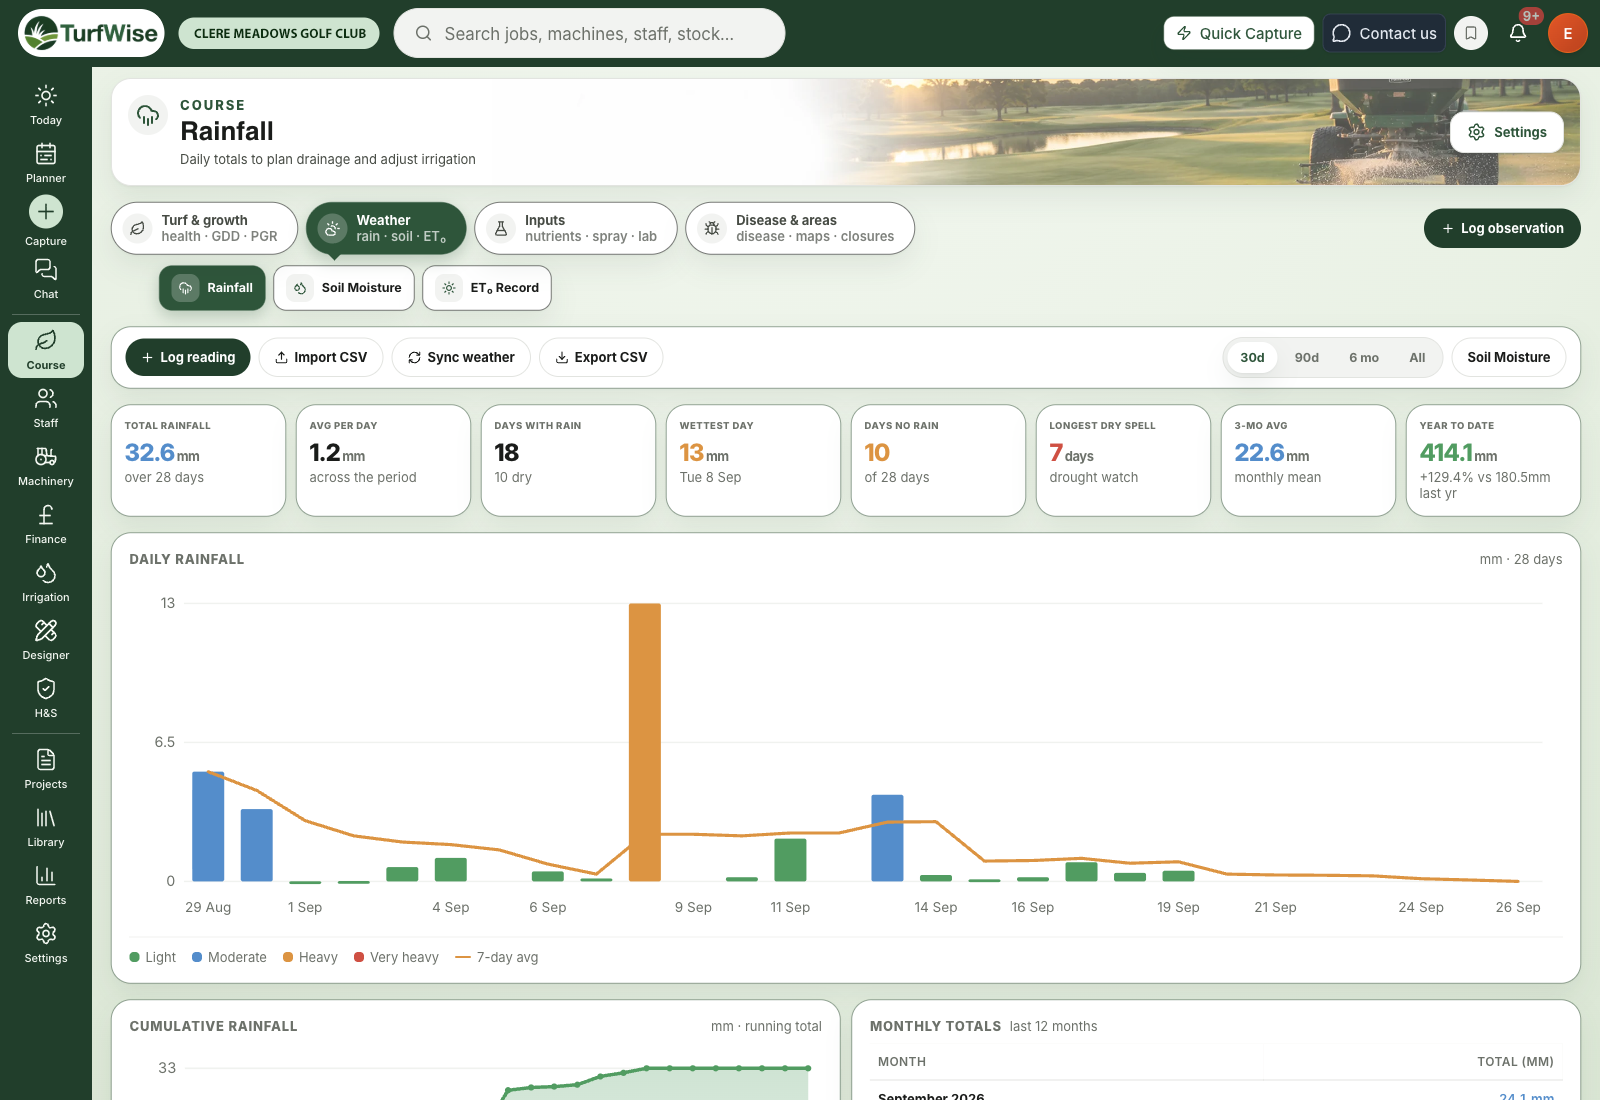
Click Course in the top bar, then Weather › Rainfall. It's included on Core.
 Open full-size image ↗
Where does the rainfall data come from?
Rainfall records come from two places:
- Your weather source, pulled in automatically. Click Sync weather to fill in any missing days. Each sync looks back over the last 180 days and fills any day that has no record.
- Your own readings from a rain gauge or a manual check, added with Log reading.
Syncing never overwrites your readings
Sync only fills days that have no record yet. If you've already logged a gauge reading for a day, it stays as you entered it.
Staff logins can view rainfall. Syncing, logging, importing, editing and deleting readings need a manager or admin login.
How do I log a gauge reading?
Click Log reading
It's the first button in the toolbar.
Fill in the reading
Enter the Date and Rainfall (mm). Set the Source to Rain gauge or Manual entry. You can add a Gauge ID if you have more than one gauge, and Notes for anything worth remembering.
Save it
The reading appears in the Records table and the charts update straight away.
Label the source honestly
Pick Rain gauge when you've read a gauge and Manual entry for an estimate. Later on, you'll be glad you can tell measured readings from guesses.
What do the figures show?
Pick a period with the buttons on the right of the toolbar: 30d, 90d, 6 mo or All. Most of the cards, both charts and the Records table update to match. 3-mo avg, Year to date and Monthly totals always look at your whole record.
The stat cards
- Total rainfall — the total over the period
- Avg per day — the daily average
- Days with rain — how many days had any rain, with the number of dry days underneath
- Wettest day — the biggest single-day total and its date
- Days no rain — dry days in the period
- Longest dry spell — the longest run of dry days. Seven days or more is marked "drought watch".
- 3-mo avg — the average monthly total across your three most recent months of records
- Year to date — this year's total so far compared with the same point last year, when there's enough data
Charts and tables
- Daily rainfall — a bar per day
- Cumulative rainfall — how the total builds up over the period
- Monthly totals — a month-by-month table covering up to your last 12 months
- Historical baseline comparison — this year's months against your historical average. Green is above average and amber is below. This only appears when historical data is available for your location.
How do I manage the records?
The Records table lists every reading with its Date, Rainfall (mm), Intensity, Source and Notes.
Intensity is a quick label: Light, Moderate, Heavy or Very heavy.
- Click the pencil icon to correct a reading, then save.
- Click the bin icon to delete one.
- Tick several rows and click Delete … selected to remove them in one go.
Correct rather than delete
If a reading looks wrong, edit it and add a note explaining why. Deleting it leaves a gap, and the next Sync weather may fill that day from the weather service instead of your gauge.
Can I import or export rainfall?
Import CSV
Got years of rainfall in a spreadsheet? Click Import CSV. Your file needs the columns Date, Amount (mm), Source, Gauge ID and Notes — only Date and Amount are required.
Choose your file
Click Choose CSV file… and pick your spreadsheet (saved as CSV). TurfWise shows a preview of the rows it found.
Decide what happens to days you already have
Pick Skip duplicates to keep your existing records, or Overwrite to replace them with the figures in the file.
Import
Click Import to add the rows.
Export CSV
Click Export CSV to download the records for the period you're looking at. It's the quickest way to get rainfall into a committee report or to your agronomist.
Common problems
- "Sync weather didn't add anything" — TurfWise may already have every day in the last 180 days. The message next to the button tells you. If it says your weather isn't set up, go to Settings (under your avatar, top right) › Weather & integrations.
- "My reading isn't on the chart" — check its date falls inside the period you've picked.
- "No rainfall recorded for this period" — try a longer period, click Sync weather, or log a reading.